EPA Hourly Continuous Emission Monitoring System (CEMS)#
Source URL |
|
|---|---|
Source Description |
US EPA hourly Continuous Emissions Monitoring System (CEMS) data.Hourly CO2, SO2, NOx emissions and gross load. |
Respondents |
Coal and high-sulfur fueled plants over 25MW |
Records Liberated |
~1 billion |
Source Format |
Comma Separated Value (.csv) |
Download Size |
9502 MB |
Temporal Coverage |
1995q1-2023q4 |
PUDL Code |
|
Issues |
Open EPA Hourly Continuous Emission Monitoring System (CEMS) issues |
PUDL Database Tables#
Clicking on the links will show you a description of the table as well as the names and descriptions of each of its fields.
Data Dictionary |
Browse Online |
|---|---|
Not browsable due to file size. |
Background#
Continuous Emissions Monitoring Systems (CEMS) are used to determine the rate of gas or particulate matter exiting a point source of emissions. The EPA Clean Air Markets Division (CAMD) has collected data on power plant emissions from CEMS units stretching back to 1995. The CEMS dataset includes hourly gross load, SO2, CO2, and NOx emissions associated with a given point source, usually a boiler. Read more about this in “Notable Irregularities”; it gets complicated.
Download the following files for further context:
How much of the data is accessible through PUDL?#
All of it! We typically update the EPA CEMS dataset quarterly, as new data releases are made.
Who is required to install CEMS and report to EPA?#
Part 75 of the Code of Federal Regulations (CFR), the backbone of the Clean Air Act’s Acid Rain Program, requires fossil-combustion units to install and use CEMS. The qualifications (§75.2(a), §72.6(a)) are closely followed by a myriad of exceptions (§75.2(b), §72.6(b), §72.7, §72.8). Among the many extenuating circumstances depicted are exemptions for retired units; old, simple conbustion turbine units; non-utility untis; units supplying generators with 25MW or less in capacity; units that have never sold their electricity; and units burning low-sulfer fuels.
Once CEMS are installed, Part 75 requires hourly data recording, including during startup, shutdown, and instances of malfunction as well as quarterly data reporting to the EPA. The regulation further details the protocol for missing data calculations and backup monitoring for instances of CEMS failure (see §§75.31-37).
A plain English explanation of the requirements of Part 75 is available in section 2.0 Overview of Part 75 Monitoring Requirements
What does the original data look like?#
EPA CAMD publishes the CEMS data in an online data portal. The files are available in a prepackaged format, accessible via a user interface, and also through the EPA Clean Air Markets API (which we use to produce archives of the data).
Notable Irregularities#
CEMS is enormous#
CEMS is the largest dataset in PUDL, with hourly records for thousands of plants spanning decades. To make this large table more usable, we distribute the CEMS data using the Apache Parquet file format rather than SQLite.
Check out the PUDL data access example notebook on Kaggle or in our
pudl-examples repository on
GitHub for pointers on how to access this dataset efficiently using dask.
EPA units vs. EIA units#
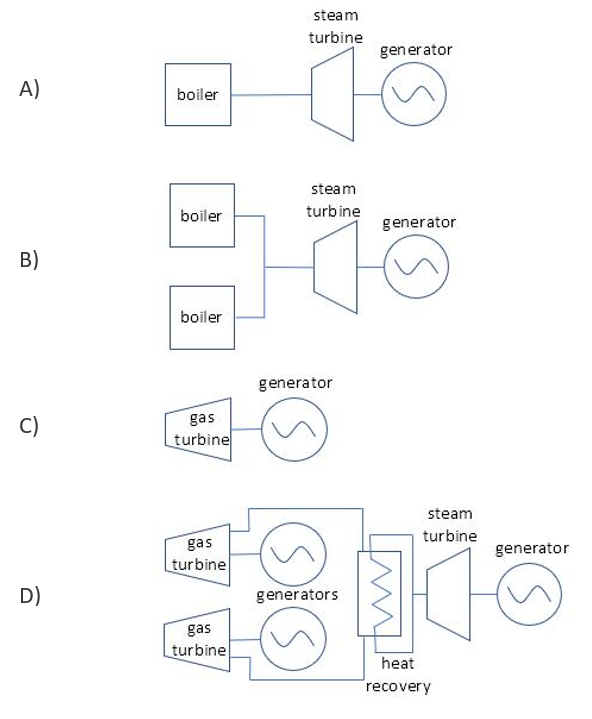
Another important thing to note is the difference between EPA “units” and EIA “units”. Power plants are complex entities that have multiple subcomponents. In fossil powered plants, emissions come from the combusion of fuel. This occurs in the boiler for coal plants or the gas turbine for gas plants. When the EPA uses the term “unit” it is refering to the emissions unit or smokestack where the CEMS equipment are (i.e., the boiler or gas turbine). When the EIA refers to a “unit” it’s usually refering to the electricity generating unit (i.e. the generator). Some plants have a one-to-one relationship between boilers and generators or gas turbines and generators, but many do not.
The EPA and EIA have addressed this discrepancy by creating a crosswalk between the
various sub-plant groupings reported to them. The plant_id_eia values from the
crosswalk are integrated into the EPA CEMS Parquet files available in PUDL.
Take a look at this helpful depiction of plant types from the EPA’s crosswalk repo.
PUDL Data Transformations#
The PUDL transformation process cleans the input data so that it is adjusted for uniformity, corrected for errors, and ready for bulk programmatic use.
To see the transformations applied to the data in each table, you can read the
doc-strings for pudl.transform.epacems created for each tables’ respective
transform function.